
22 Power Plants Target Completion as WTI Crude Jumps 76% in Five Months
Twenty two power plants complete as WTI crude jumps 76% in five months. Lock contracts, stress test capex, and map grid capacity before the buyer's market disappears.

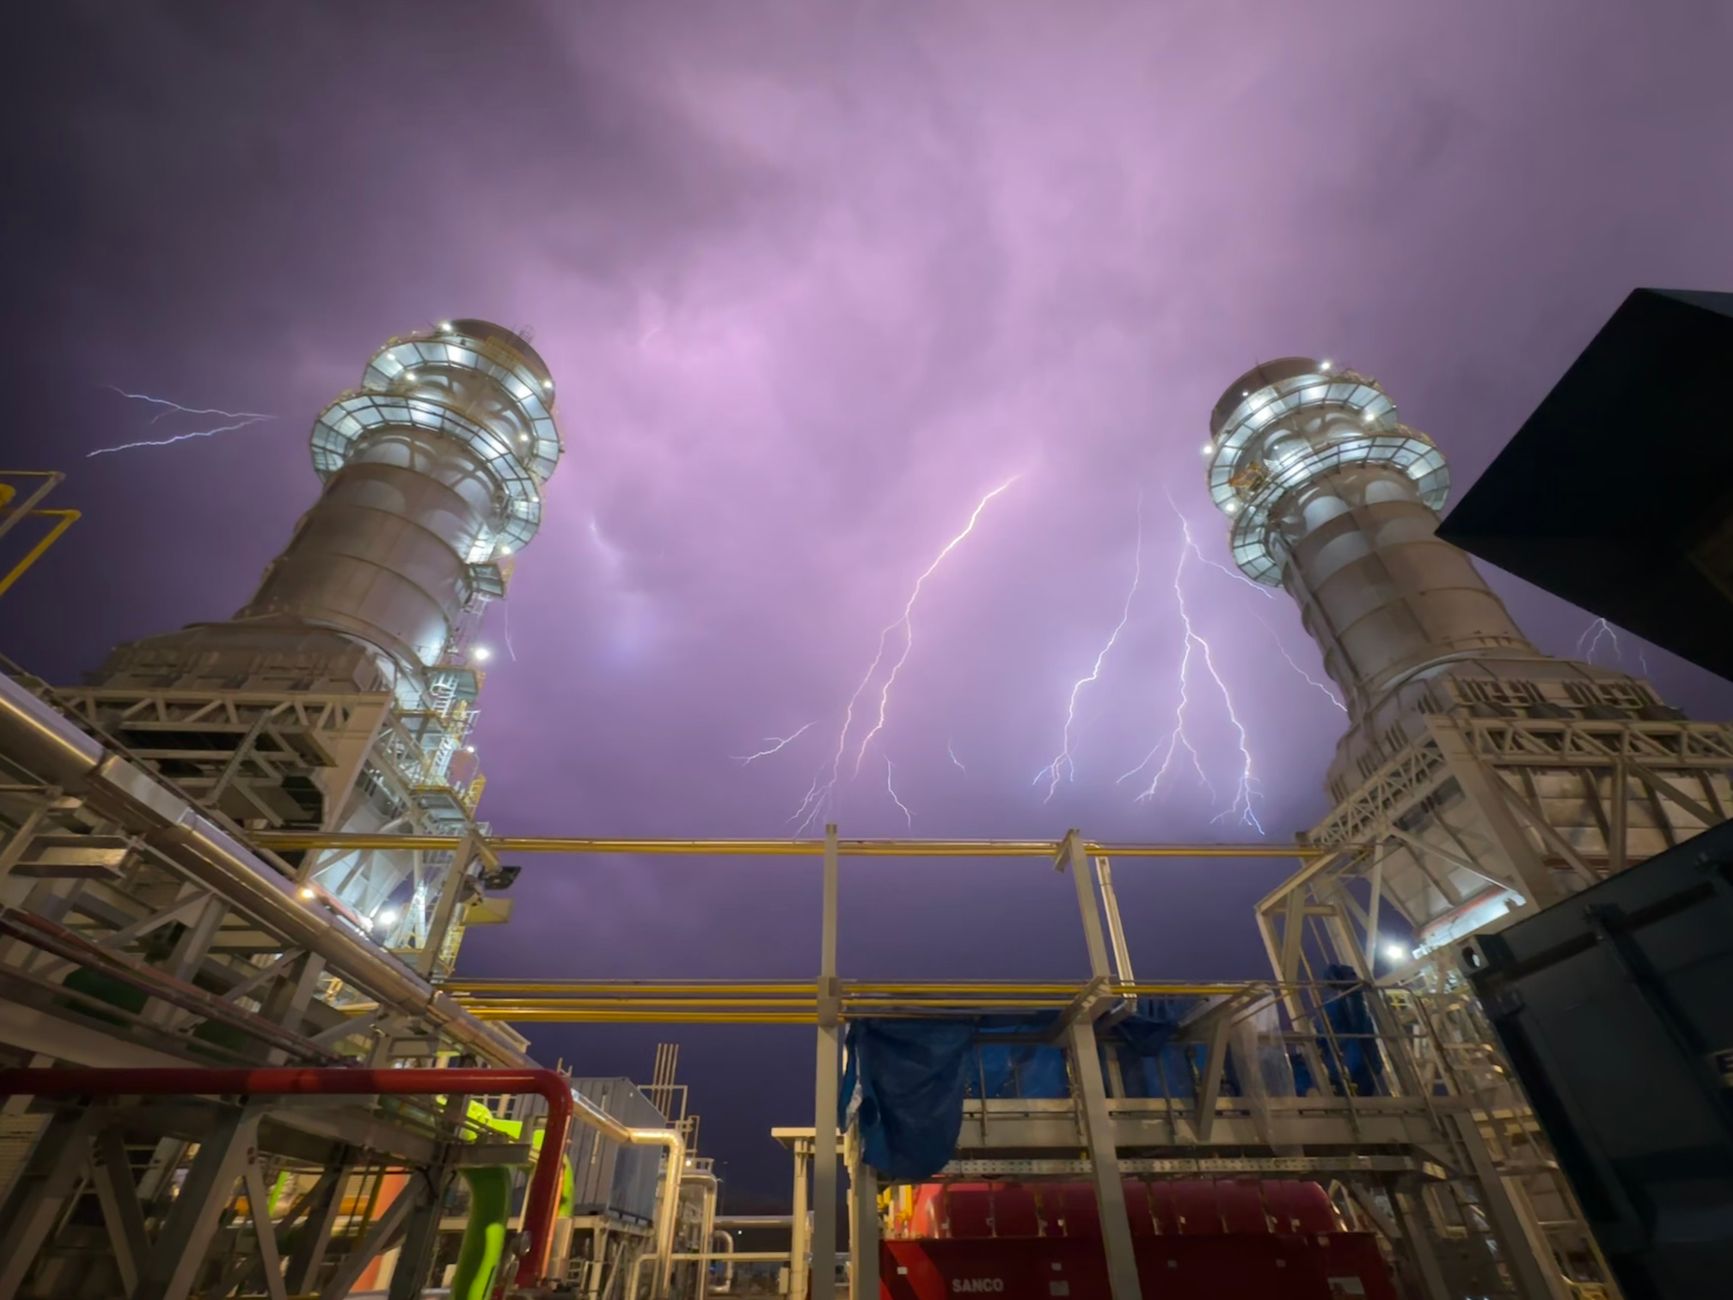
Twenty two utility scale power plant projects across North America are racing toward completion right now. But the energy cost environment they are entering tells a different story. WTI crude oil surged from $57.97 per barrel in December 2025 to $102.13 in May 2026 before pulling back to $84.81 in June, according to Federal Reserve economic data. That is a 76% spike in five months. Any operator planning an expansion around cheap, plentiful electricity needs to recalibrate immediately.
The Capacity Buildout Meets a Price Shock
Twenty two utility scale power projects tracked by Industrial Info Resources have cleared financing and permitting. They represent meaningful generation capacity additions at the exact moment demand from data centers, reshored manufacturing, and industrial electrification is accelerating. The projects should bring relief. In theory, more supply means competitive rates. But the crude oil price trajectory complicates every assumption baked into those project economics.
Natural gas fired generation still dominates new capacity in North America. When crude moves like this, natural gas follows with a lag. The floor under electricity costs rises regardless of how many turbines spin up. Operators who assumed the capacity wave would deliver cheaper power need to separate two questions: will there be enough megawatts, and will those megawatts be affordable? The answer to the first is probably yes, regionally. The answer to the second depends entirely on what energy markets do over the next 18 months.
Source: Federal Reserve Economic Data (FRED) | NeuralPress analysis
That trajectory is the context for every capacity and cost decision below. Crude dropped as low as $57.97 in late 2025, lulling some planning teams into optimistic projections. Then it nearly doubled. The pullback to $84.81 in June 2026 is still 10.6% above August 2024 levels. Volatility of this magnitude changes the math on every long term power contract, site selection model, and capex timeline in industrial operations.
Lock in Power Contracts Before New Demand Absorbs the Capacity
The 22 projects coming online create a narrow window. Right now, regional utilities in corridors with multiple projects nearing commercial operation have capacity to sell. They need anchor tenants. That gives industrial buyers leverage to negotiate long term electricity contracts at rates that reflect current supply additions, not future scarcity.
The decision is binary. Do you lock in a 5 to 7 year fixed rate contract now, or do you float and hope the market stays favorable? The framework for making that call starts with your facility's energy intensity. If electricity represents more than 8% of your operating costs, floating is speculation, not strategy. You are running a manufacturing operation, not a trading desk.
Federal Reserve data shows WTI swinging from $60.06 in November 2025 to $100.32 in April 2026. That kind of volatility flows downstream into electricity futures within two to three quarters. Utilities pricing new contracts today are already building in risk premiums based on that whiplash. The operators who move in the next 90 days will get better terms than those who wait for Q4. Every month of delay is a month closer to data center operators and semiconductor fabs absorbing the excess capacity those 22 plants were supposed to deliver. Once the megawatts are spoken for, the buyer's market disappears.
Site Selection Just Became a Regional Capacity Bet
If you are evaluating locations for a new manufacturing facility or distribution center, the question is no longer just about labor costs, logistics proximity, or tax incentives. It is about whether the local grid can actually serve your load at a predictable cost for the next decade.
The 22 projects are not evenly distributed. They cluster in corridors where utilities and independent power producers see demand signals strong enough to justify billions in capital deployment. Those corridors are your shortlist. Regions without active generation projects in the pipeline are telling you something. Either demand is not materializing there, or the regulatory environment makes development uneconomical. Both are red flags for a manufacturer planning a 15 year facility lifecycle.
The decision framework here is straightforward. Request project level data from regional utilities and grid operators. Map completion timelines against your construction schedule. If your facility will begin drawing load before at least two utility scale projects achieve commercial operation in that region, you are competing for constrained megawatts. Crude oil at $84.81 and climbing means gas fired generation costs are elevated. Regions adding renewable capacity alongside gas projects offer better long term price stability. The WTI spike from $57.97 to $102.13 in five months proves that single fuel exposure in your grid region is a balance sheet risk, not just an operations inconvenience.
Capital Allocation Timing Depends on the Energy Cost Curve
Every industrial capex decision carries an embedded energy cost assumption. Most models built in late 2025 assumed crude in the low $60s and electricity costs trending flat to down. Those models are broken. Crude averaged $63.96 in September 2025 and hit $100.32 seven months later. If your board approved a plant expansion based on Q3 2025 energy assumptions, the project economics have shifted materially.
The question facing CFOs and COOs is not whether to invest but when. Accelerating a project to lock in current power contract rates may be smarter than waiting for construction costs to moderate. Delaying until crude stabilizes could mean missing the capacity window entirely. The framework is to stress test your capex model at three crude price scenarios: $65, $85, and $105. If the project pencils at $105 crude, proceed and lock your power contract now. If it only works at $65, you are building on a foundation of hope.
The 22 projects in the pipeline signal that utilities believe demand justifies investment. That conviction is worth noting. These are not speculative ventures. Financing and permitting are cleared. Industrial Info Resources tracks them as active with defined completion targets. But the energy cost to operate those plants is rising. New generation capacity does not automatically mean cheaper electricity. It means available electricity. The price depends on the fuel, and the fuel market just reminded everyone that stability is a fantasy. Operators allocating capital in H2 2026 should budget for electricity costs 15% to 25% above what their models assumed 12 months ago.
Workforce Planning for Facilities You Have Not Built Yet
There is a secondary effect of 22 power plants reaching completion simultaneously. Every one of those projects needs commissioning teams, maintenance crews, and operations staff. They are drawing from the same skilled labor pool that your new manufacturing facility or distribution center needs. Electricians, instrumentation technicians, high voltage specialists, and controls engineers are already scarce. Two dozen power plant projects coming online at once tightens that market further.
The decision for operations leaders is whether to start recruiting and training now, before the facility is built, or wait until commercial operation and compete for talent with every utility and independent power producer in the region. The framework is simple math. If your facility is 18 months from operation and three power plants in your target region complete in the next 12 months, those plants will absorb local technical talent before you open your doors. Start workforce development partnerships with regional technical colleges and trade programs today. Budget for relocation packages. Consider shift differential premiums that compete with utility compensation scales.
Federal Reserve data showing crude volatility also signals something about workforce mobility. When energy sector hiring surges, as it does when crude runs above $80, industrial manufacturers lose skilled workers to oil and gas. At $84.81 per barrel, the upstream sector is hiring aggressively. Your talent pipeline is under pressure from both directions.
The 22 power plants are not just an electricity story. They are a signal about the operating environment for the next three years. Energy costs are volatile and climbing. Capacity is being added but will be absorbed fast. Regions with projects in the pipeline have advantages that will compound. The operators who treat this moment as a procurement window rather than a news headline will build the cost structures that define competitive positioning through the decade. The ones who wait for clarity will find that clarity arrives as a price increase on their next utility bill.
This article is part of the Industry Intelligence series on NeuralPress. New analysis published daily.